Cloud Hosting Performance Data
We currently have 7 solar hot water systems owned by third parties, with monthly billing for the energy used. To see the data, we developed a web hosting service in conjunction with a data system that controls the collector pump and energy meter, monitors all the data with calculations, sums, and averages, and reports the data to the cloud for display on a multipage dashboard.
We call the system CMR, for Control/Monitor/Report. There are several flavors. One transmits the data directly over a cellular telephone link to our server for uploading to the cloud. The other dumps the data into a LAN, which can also be sent to the cloud hosting service. The cellular link is useful if there is no ethernet link to the equipment, or if there is a military or prison security issue that will not allow a system to be hooked into it. We also have 4 systems (soon to be 9) that have local dashboards not connected to the cloud.
Being able to see the system performance promptly allows us to do maintenance and performance troubleshooting daily. Repairs for distant systems are therefore much easier and downtime reduced. We have seen pump failures, sensor failures, power failures, and many other indications of improper operation. The CMR system will restart automatically after a power failure and the program can be updated remotely if needed to change settings or parameters.
The CMR system has also been very useful in analyzing usage patterns, ground water temperatures, and other characteristics of system performance. For example, a school may fail to report that it has no classes in certain parts of the year, or that it doesn’t use certain dorms during summer school. This could lead to an error in system sizing, and indicates that the school needs to make sure to use the solar dorms for summer classes. A wealth of historical data is available by summing parameters over six months, or a year. A very valuable parameter that is simply not available in most places is the entering cold water temperature for every month of the year. The CMR system makes this very easy to find.
One purpose of this post is to share a unique piece of daily data that appeared in our system. One of the third party owned solar hot water systems is located at the New Hanover County Jail, in Castle Haynes, NC. There are over 500 inmates, with an average daily hot water consumption of about 3500 gallons. The solar system includes 1600 ft2 (gross) of collectors and a 2000 gallon Fluid Handling System. For the period of Jan – May, 2015, the system delivered an average of 230 Btu into every gallon of water heated, or about 890 kBtu/day, ranging from about 400 to 1600 kBtu, depending on weather and usage.
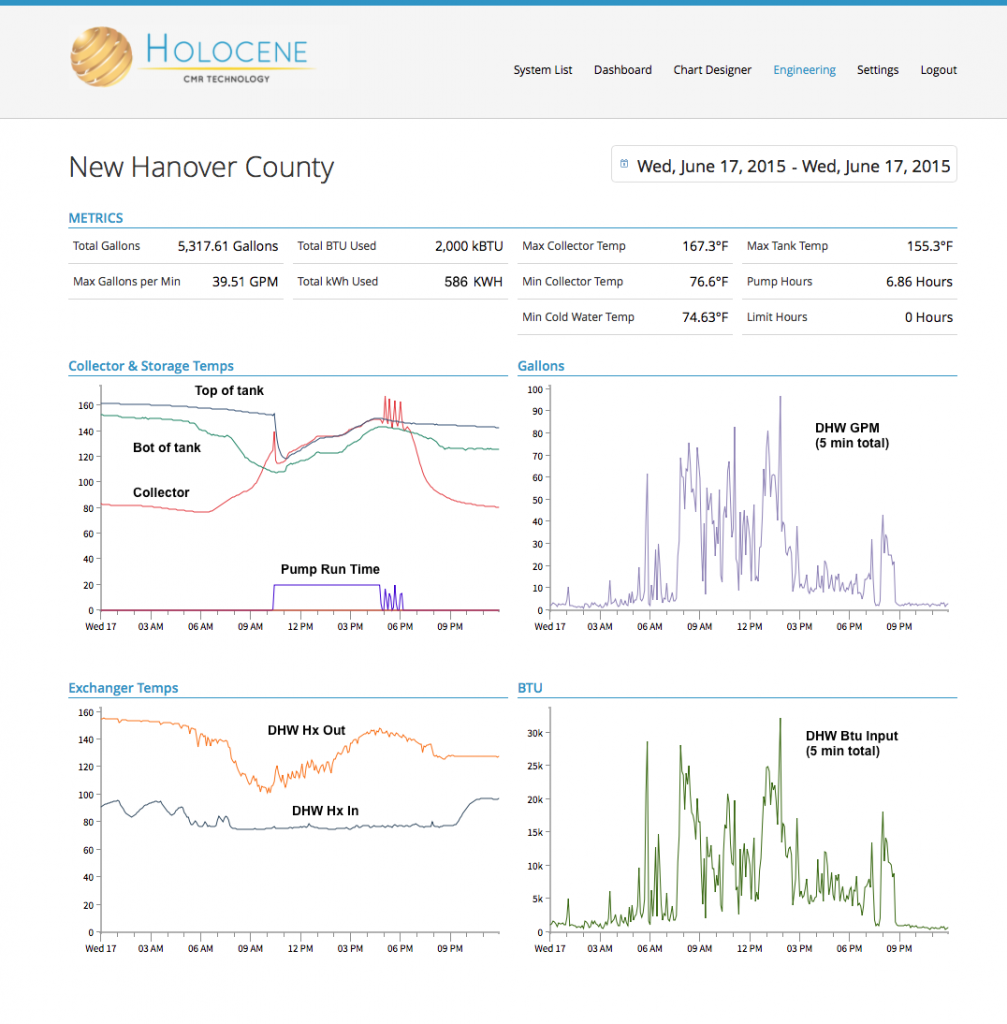
However, on June 17, 2015, the system delivered 2.0 MBtu in one day. That is the highest output we have ever seen, and we wanted to share it with you (see fig. 1). There are several reasons this number is so high. First, the 5317 gallons/day usage is way above the typical 3500 gallons/day. The bigger the load, the higher the output. Second, it was a bright, sunny day. On the other hand, the system ran only 6.86 hours because the tank started out hot and the weather was cloudy until after 10:00.
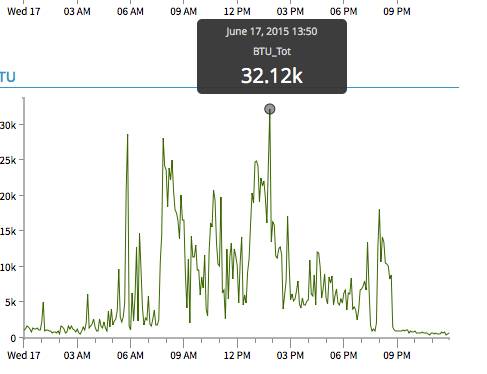
There are many things that can be learned from this data, that are not explicitly shown. For example, the highest Btu transfer rate was 31.12 kBtu over 5 minutes at 13:50 (see fig. 2). This converts to an hourly rate of 373 kBtu/h. The instantaneous efficiency of the heat exchanger can be determined by comparing the 41 F temp rise of the water going through the exchanger to the maximum possible rise of 45.11 F, or 90.9%. The flow rate was 19.3 gpm.
We hope the future of solar includes more data reporting systems, so we can improve our system sizing and performance estimations, and verify the results.


