Optimal Design in Solar Hot Water Systems – How Does Size Alter Performance?
As I was working on a recent F-Chart analysis for an upcoming project, I decided to graphically show how the output of individual collectors drops as the solar fraction increases for solar hot water systems. The energy output per collector, often referred to as the “collector yield”, is measured in million British thermal units over the course of the year (MBtu/yr). This metric is very important because the best designed systems should have each collector working as hard as it can. After all, the owner of the system has invested initial capital in each and every collector, so solar thermal collectors should behave as well-paid employees! Not lazy bums.
The solar fraction is defined as the percentage of the overall load that is supplied by the system over a specific period of time. For example, if a building uses 1000 gallons of hot water per day and a solar hot water system supplies 500 gallons of that, the solar fraction equals 50% for that day. So, the question is often asked, “Why not go for a 100% solar fraction all the time then? After all, if X number of solar collectors will supply half the load, 2X should supply the whole load… right?” Not exactly.
First of all, unlike conventional energy sources, we can’t just flip a switch to make the sun shine when we need it. It can be cloudy or rainy for several consecutive days. There’s nothing we can do about the weather. This means the contribution from a solar water heater could be zero for many days out of the year. That means getting an annual solar fraction of 100% is not practical.
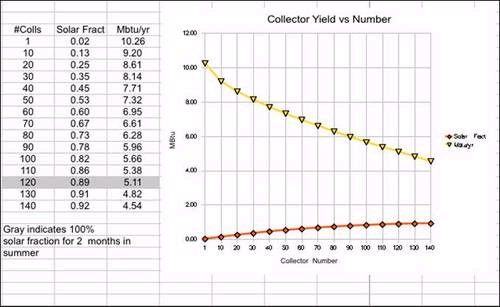
“Well, if you can’t get 100%, shouldn’t you go for as much as you can get?” That’s not what the graph below tells us. We see that as the number of collectors in a system increases, the solar fraction does too… but not proportionately. Going from 20 collectors to 30 collectors increases the solar fraction from 25% to 35%. But increasing the number from 80 to 90 only increases the solar fraction by 5%, and going from 130 to 140 gives an increase of only 1%. This is a classic example of the Law of Diminishing Returns!

Declining Per Unit Output for Solar Hot Water Systems
The graph shows that as the number of collectors goes up, the yield per collector steadily decreases. Each additional collector makes all the others a little bit lazier. Remember, adding collectors adds cost… We don’t want to be spending more money and have the performance per collector going down. In any diminishing return situation, the question is where to stop.
I’ve found in my many years of experience that the sweet spot for most systems is a solar fraction range somewhere between 30% and 60%. Folks who design systems above the sweet spot end up throwing away money. The cost of their system increases but the energy output per unit drops off. The sweet spot varies with the local climate. In the hot and sunny desert, 100% may be reasonable. At the North Pole, 10% may be the best number.
A few points worth mentioning… In the analysis above, I used the same hot water demand throughout, and changed the number of collectors. I also changed the corresponding size of the storage tank. The storage tank is always sized to match the area of the collectors.
Note that the monthly solar fraction doesn’t reach 100% (in June and July) until there are 120 collectors, and the annual solar fraction is 89%. Each collector produces 5.11 MBtu/yr which is 37% less energy than a system with a solar fraction of 35%. That’s not a good deal for the owner. Don’t make this mistake if you’re designing a solar hot water system!
Dr. Ben
